Mapping Toilets in Informal Settlements
The Promotion of Access to Information Act (PAIA) enacts the constitutional right of access to state information, and it was through such a PAIA request to the City of Cape Town that Ndifuna Ukwazi, a Code for South Africa partner, received a “data dump” that contained a very interesting dataset. It was a database of toilet facilities in informal settlements, and it was contained in a series of pdf documents. Most exciting was the accurate xy-coordinates for every public toilet facility. Using these coordinates,we can pinpoint the location of Cape Town’s informal settlements. The most depressing aspect of the data was that the files contained text that had been previously printed out, and then scanned in. This makes it impossible to extract with traditional PDF scraping tools like Tabula.
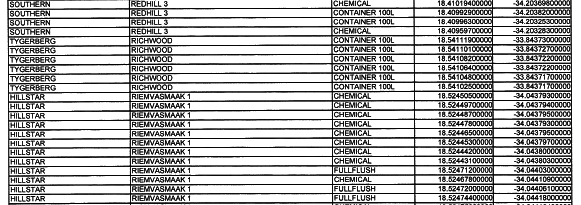
Manual recapture of the data was out of the question, there were 16 pdf documents, of around 16 pages each, all scans of spreadsheet data. This is what they looked like:

What I discovered is that Adobe Acrobat Professional can convert such a scanned image into text, somewhat messily, but it can be done. Without the licensed software, however, I utilised the trial version, which gave me 30 days of usage, ample time to convert each of these documents.
Did I mention that the optical character recognition was somewhat messy? What followed was many hours of data cleaning in Excel, as not even Open Refine could help me yet. The data wasn’t even consistently broken into cells correctly. There were random haphazard groupings of cells that needed to be cleaned up for about 27,000 rows of data. After this painstaking process and some simple Open Refine cleaning, I held in my hands a complete and clean dataset of xy-coordinates to point me to the location of the informal settlements.
What I wanted to achieve was a link to the Census 2011 data to understand firstly the extent to which these areas had been counted in the Census, which would pave the way to trending the growth of these areas in the time since the survey. Linking the data to the Census would also give insight into the demographics of the informal settlements that were counted on the Census, helping us to better understand the quality of life for the residents of these areas.
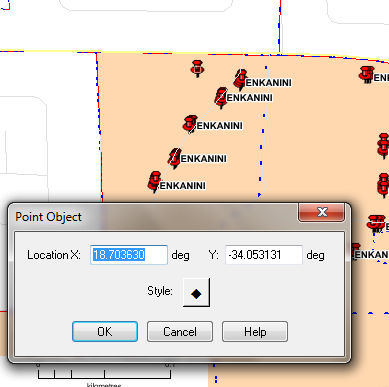
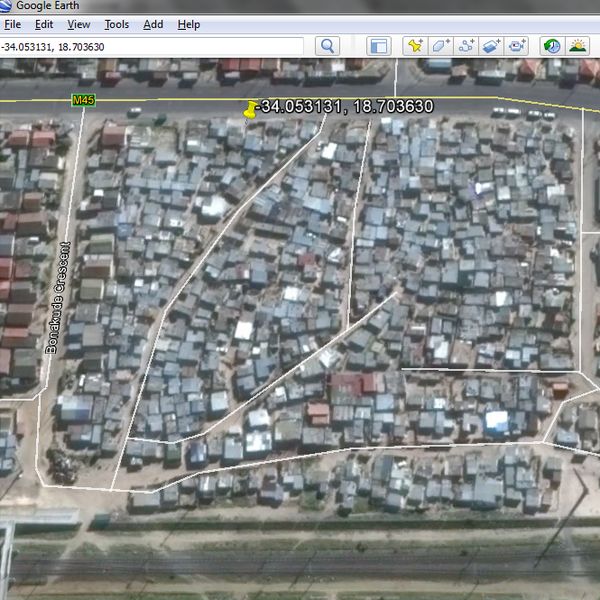
But before I could gain any of these insights, I needed to create a new dataset from the toilet GPS coordinates, because I needed polygons around the informal settlements in order to link to the Census data. In the GIS environment, I could match polygon boundaries with the Census Small Area Layer, which would bring the indication of demographics to the smallest micro level possible with the data that we have available. So “alt/tab”ing my way between Google Earth and the GIS, I copied and pasted xy-coordinates of the different clusters of these toilet facilities, and manually drew in the boundaries of the informal settlements. If you ever need to do a similar exercise, just remember that the Americans are backwards - so paste the y-coordinate into Google Earth first, followed by a comma, and then paste the x-coordinate before hitting Search.


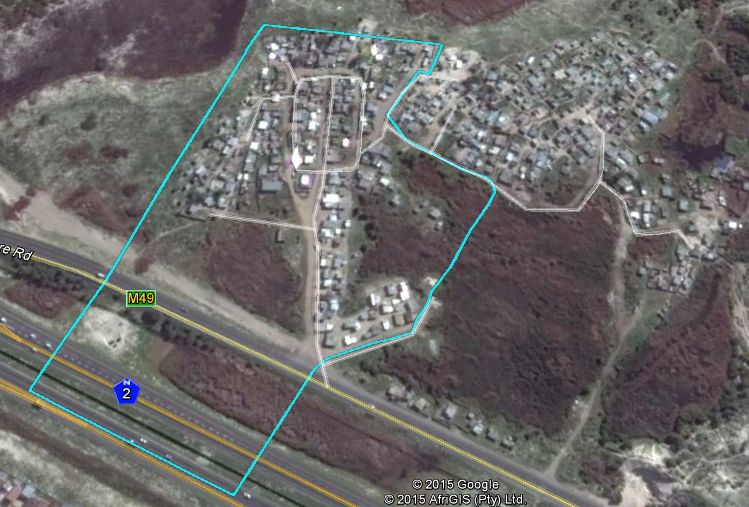
What I discovered was that in many instances the Census Small Area Layer boundaries matched exactly the boundaries of these clusters of shiny tin roofs on the satellite images, which tells me that the census sampling took them into account. In the below image the blue line indicates the boundary of a Small Area Layer polygon which matches a portion of the settlement known as “Los Angeles” neatly:

There were also many instances where the boundaries of the informal settlements had no correlation at all with the Census boundaries, as can be seen in the above image - the portion of Los Angeles to the North West has no SAL polygon containing it. Did these settlements exist at the time of the survey and were simply not counted? Or alternatively, are they new settlements that have mushroomed since the survey was conducted?
The joy of having one’s hands on accurate geographic data like this is that you can start to find these interesting questions, and begin to pursue the answers. But it’s always the data that kick starts this process. Without the data, in an accessible format, without the time dedicated to cleaning and ensuring accuracy, and without the tools like Google Earth which enable the entire process, we wouldn’t even know which questions to ask.
The data is available in Excel format on Code for South Africa’s open data portal, along with some demographics, counts of available toilet facilities per settlement, travel distances and drive times to the Cape Town CBD. A cautionary note on using the demographics - there is a detailed metadata document available in pdf that is attached to the dataset on the portal. Please refer to it, and ensure that you understand how to use the data. The assigned demographics can and do, only describe the portion of the areas that were represented on the Census survey.
The dataset consists of 326 informal settlements in the greater Cape Town metropole. The Census Survey in 2011 counted a total population of 581,854 human beings living in 197,907 households with an average of 3 people per household in these areas, 18% of which show a predominant age group of under 10 years.
