Update: 19 December 2015
I have updated the numbers in this post using the final, audited 2013/2014 figures. The numbers have changed quite a bit but no less interesting. In the text below, I have struck out the original numbers and replaced them with the correct figures.
Traffic accidents in South Africa are a serious cause for concern in South Africa. Finding accurate data on road deaths is difficult but the WHO estimates approximately 14,000 deaths in 2009, accounting for 31.9 deaths per 100,000 people. Despite this, speed traps often seem to be engineered to trick drivers instead of aiming to reduce road deaths. To explore this, I decided to investigate whether municipalities are cynically using fines as an excuse to raise revenue.
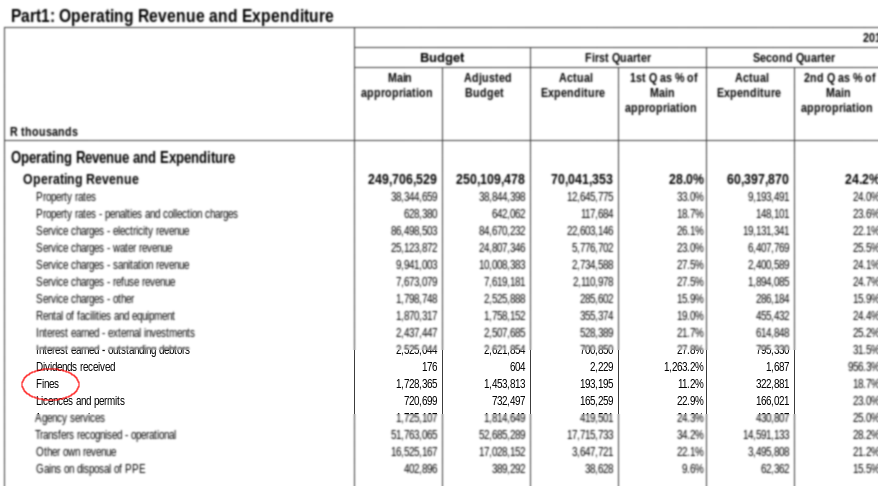
I started with the hypothesis that municipalities on major highways (N1, N2, N3, etc) earn more from fines than other municipalities. The best way to answer that question is to look at the financial reports for each municipality. Thankfully, these reports are standardised by the National Treasury making it easier to find the relevant figures. Below is an excerpt from the report for the nation as a whole.

Notice that fines are reported as a revenue stream along with other income sources such as rates, electricity, water and other municipal services. Before continuing, a quick caveat, all of the research in this article refers to this fines line item. It isn’t clear what percentage of fines are traffic related. While I am making a big assumption that traffic fines (and speeding fines in particular) comprise a large percentage of this figure, I could be completely wrong . I don’t think that assumption is too far off the mark though, and hopefully I can convince you of that in the discussion below. Update 2015/12/19: At least for Ubuntu 99.99% of fines refer to traffic fines. It still isnt clear how many of those are for speeding
So what do we know about fines nationally? In the financial year ending June 2014, R1bnR3.3bn in revenue from fines was reported by municipalities. I suspect that this is actual money received by municipalities rather than fines issued.What this number actually means is a little beyond me. According to the accounting guidelines for traffic fines, the figure should represent the value that is expected to be received. In other words, it is probably more than the final figure received and less than the value of fines issued. I’m not an accountant though and some of the finer details are difficult to understand. According to the previous minister of transport, only 13% of traffic fines are actually paid. The total value of fines actually issued is probably much larger.
Nationwide, fines represent a tiny fraction of all municipal revenues. The per capita revenue (i.e. revenue from every man, woman and child) from fines is R65.20.
That’s the national average. What happens when we only focus on national roads?
The image below gives you an idea of what to expect when you drive on the N1 from Cape Town to Johannesburg:
Each bubble represents a municipality. The larger the bubble the more the municipality earns from fines relative to the national average. Bear in mind that large municipalities such as the Cities of Johannesburg and Cape Town earn a lot more from fines in rand terms. There are simply more motorists to fine. In order to compare apples with apples, I normalised in two ways:
- Firstly as a percentage of budget. The larger the number, the more the municipality relies on fine revenue to fund itself.
- Secondly, I compared it to the monthly revenue per capita (as before, how much the municipality earns for every man, woman and child in rand terms). It would be better to compare to the number of cars but that data isn’t available. This second indicator suggests (in some cases) how much money is earned from out-of-towners.
The number in the centre of the bubble represents the ratio between the earnings of that municipality to the national average. You’ll notice that Laingsburg is 18 times more reliant on revenue from fines than the national average. It also earns 32 times more per capita (R2,065.54).
The big one of course is Ubuntu municipality, more commonly known as Richmond to those who drive the JHB/CPT route. An informal survey of my peer group reveals that the Richmond traffic department sets up cameras in really tricksy places. It’s apparently very easy to be caught by their cameras. Fine amounts are often in the thousands of rands, even when driving 20kms over the speed limit. According to Arrive Alive, fines amounts are not regulated. A municipality can charge anything they like. A quick search on Google suggests that Ubuntu municipality is notorius for their traffic fines. Since the municipality is likely to be far away from where you live, it is unlikely that you will defend yourself at the local magistrates court.
So what is all the fuss about? Well, 49% of the municipality’s revenue comes from fines. That’s more than rates, electricity, water, refuse removal and sewage combined! It is a major source of income for the municipality. Their population is under 20,000 people (according to the 2011 census) so their rates base is pretty low. Revenue needs to come from somewhere. More shocking is that per capita, they earn an annual figure of R2,821.01 (44 times the national average). Wow. See what I mean about fines coming in from out-of-towners? It’s impossible that this money was only earned from fining residents.
What about the other major routes?
I think that these images tell a pretty compelling tale. One thing to notice is that municipalities in the Western Cape seem to earn a lot more from fines than muncipalities in other provinces. Driving through the Eastern Cape and Free State seems to be relatively safe (from a fines point-of-view).
Let’s play devil’s advocate. What else could this mean?
Firstly, municipalities on major highways are likely to see more traffic than municipalities further away from national roads. It makes sense that they should earn relatively more money from fines. That argument isn’t convincing. In each of the examples some municipalities earn a tiny fraction of what some of their neighbours are earning, all of which are on the same national road.
Another argument is perhaps that some municipalities are a lot more efficient at collecting fines. Perhaps there are conditions in certain places that make speeding more likely. These are legitimate possibilities but we don’t really have data to prove this one way or another. Ideally, a dataset showing accidents over time would help us determine whether traffic departments are doing a good job. Perhaps these municipalities are making roads safer by reducing accidents. Without this data we cannot know for sure.
Why is this important anyway?
We need to make our roads safer and reduce the number of horrific accidents that are reported in the news every holiday season. If fines are seen as revenue streams, municipalities are likely to set speed traps in the wrong places. In fact, they are not incentivised to reduce accidents at all. I don’t believe that hiding in the bushes and catching drivers unawares will make much impact. You often only know that you have been caught when that ominous letter with red writing appears in your postbox. A better approach would be to place more cameras in high risk areas. In fact, if we ensured that cameras are highly visible, drivers would almost certainly slow down in dangerous stretches of road.
I don’t have a real conclusion here. Hopefully these graphics, at the very least suggest to drivers to be careful in those municipalities regardless of the reason.
UPDATE: 9 Jan 2015 - Jason Norwood-Young makes the interesting observation that if fine revenue in Ubuntu municipality was re-distributed to all households that earn R20,000 or less annually, you could give them each R22,600 per year, or about R1,900 per month. If you limit it to househlds earning R10,000 or less per month, that figure rises to just over R4,000 per month. Of course, this money might be used for service delivery anyway so re-distribution make not result in a net gain but it gives you an idea of the size of these numbers.
UPDATE: 9 Jan 2015 - You can find the raw data here.
The technical stuff
Feel free to embed any of these visualisations on your own site.
Place any of these anywhere on the page.
    <div id="n1" class="roadmap"></div>
    <div id="n2" class="roadmap"></div>
    <div id="n3" class="roadmap"></div>
Place at the bottom of the page
<script src="https://www.openup.org.za/traffic-fines/times/libs/fines.js"></script>
The embeds are responsive and will resize according to the screen size. They are especially suited to mobile viewing.


